- Gas generator speed
- Exhaust temperature
- Expected light-off
See it work
One platform.
Every operation.
A real operating question needs live data, documents, records and the people on site, and they have always lived in different places. The same edge, the same data model and the same interfaces answer it at sea, in a generator yard and across a busy port. Pick one.
Gas turbine 2 was slow to light off this morning. What happened, and what should we check?
Firing speed and light-off
- 14 months agoIgniter plugs replaced
- 2 years agoFuel nozzle inspection
2 earlier slow starts. Both cleared by igniter work.
SailPlan
Light-off on GT-2 came 6 seconds late on the last two starts. Its igniters were replaced 14 months ago, and the two earlier slow starts in its history were both cleared by igniter work. Check the igniters first, then run the Firing speed and light-off procedure.
Telemetry · 2 startsLM2500 manual2 service reportsCondition history
Illustrative scenario, built the way the SailPlan demo works: live telemetry, equipment manuals and procedures, and written service reports answering one question together.
Why is Gen 2 running hot?
- Coolant (raw 960 ÷ 10)
- Load
- Rating
QSK60-G23 generator set
- Rating
- 2,500 kVA / 2,000 kW
- Engine
- 16 cyl V, 60.2 L
- Output
- 60 Hz
- INV-2041Coolant filter4
- INV-2043Lube oil filter6
- INV-2310Coolant, 20 L3
“Coolant temp on Gen 2 keeps creeping up under load since Saturday. Do we have coolant filters in stock?”
SailPlan
Coolant has been climbing under load since Saturday, matching the operator's report. Load is within the 2,000 kW rating, so the engine is not overworked. 4 coolant filters are in stock in the site store.
Telemetry · ModbusSpec sheetSite inventoryOperator email
Illustrative scenario: one generator in a 15-unit yard on prime power. The same record works for standby generators.
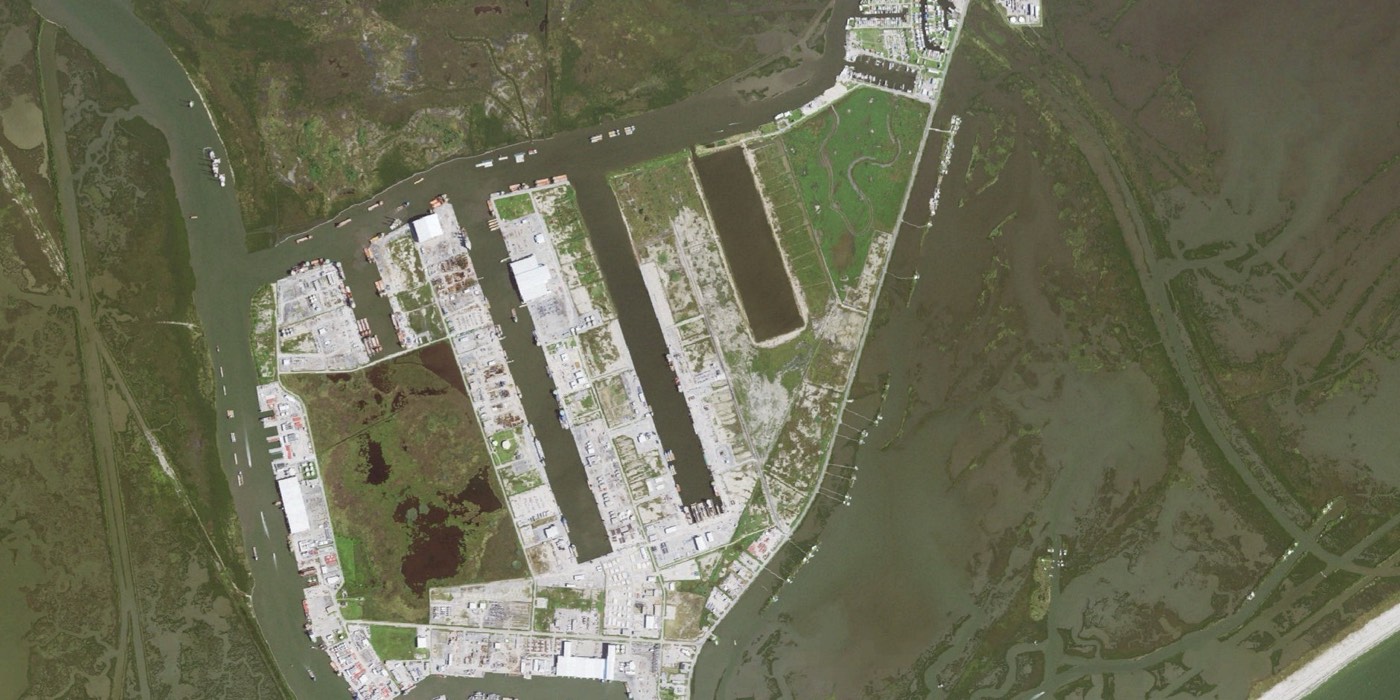
What drove Tuesday morning's peak at the north gate, and what do we change?
- Sensors
- Plume
- Trucks · cameras
- Vessels · AIS
- North gate sensor
- Other sensors
Trucks queued at the north gate from 07:00, about 40 at the peak.
- 06:40Supply vessel berthed, north terminal
- 07:15Second vessel berthed, same terminal
SailPlan
Two vessels berthed at the north terminal within 35 minutes, and about 40 trucks queued at the gate to meet them. The plume model places the peak on the terminal, not the highway. Staggering berth windows and gate appointments flattens it, and cuts the energy spent idling. The stakeholder report is drafted from the same data.
12 sensorsPlume modelGate camerasAIS
Illustrative scenario: sensors, a plume model, cameras and vessel traffic fused into one picture of how a port uses energy, and one source for the reports its stakeholders need. Aerial imagery: USDA NAIP via USGS The National Map.